| Asset | Commodity | 2020 | 2019 | 2018 | 2017 | 2016 | 2015 | 2014 | 2013 | Projects |
............................

|
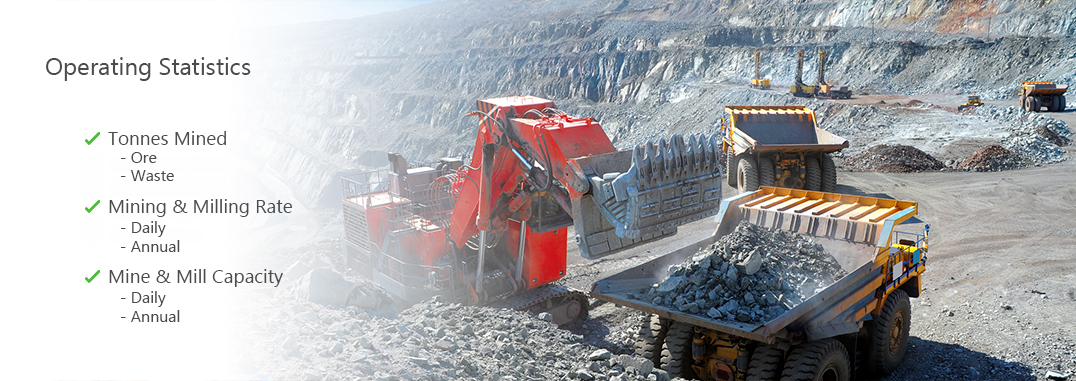
- Ore tonnes mined
- Tonnes milled
| | | | | | | | | |
............................
|
| | | | | | | | | |
............................
|
| | | | | | | | | |
............................
|
- Annual processing capacity
- Ore tonnes mined
- Waste OP
- Total tonnes mined
- Tonnes processed
| | | | | | | | | |
............................
|
- Plant annual capacity
- Ore tonnes mined
- Tonnes milled
| | | | | | | | | |
............................
|
- Annual processing capacity
- Ore tonnes mined
- Tonnes processed
| | | | | | | | | |
............................
|
| | | | | | | | | |
............................
|
- Daily ore mining rate
- Daily milling rate
- Daily processing capacity
- Annual milling capacity
- Ore tonnes mined
- Tonnes milled
| | | | | | | | | |
............................
|
- Annual milling capacity
- Tonnes milled
| | | | | | | | | |
............................
|
- Annual milling capacity
- Ore tonnes mined
- Waste
- Total tonnes mined
- Tonnes milled
| |
- 15,000
- 14,884
- 24,662
- -
- 15,410
|
- 15,000
- 13,535
- 30,500
- 44,035
- 15,823
|
- 15,000
- 13,605
- 24,100
- 37,705
- 14,834
|
- 15,000
- 10,367
- 17,900
- -
- 10,453
| | | | |
*** Multi - mine Operation
* Part of an Operation
^ Guidance / Forecast / Projected Avg. Annual
¨ Combined production. Please see the Property Profile for details.
|